Data platform
Bespoke software
The pain
Analysts write brittle custom scripts to pull data from disconnected silos.
What we build
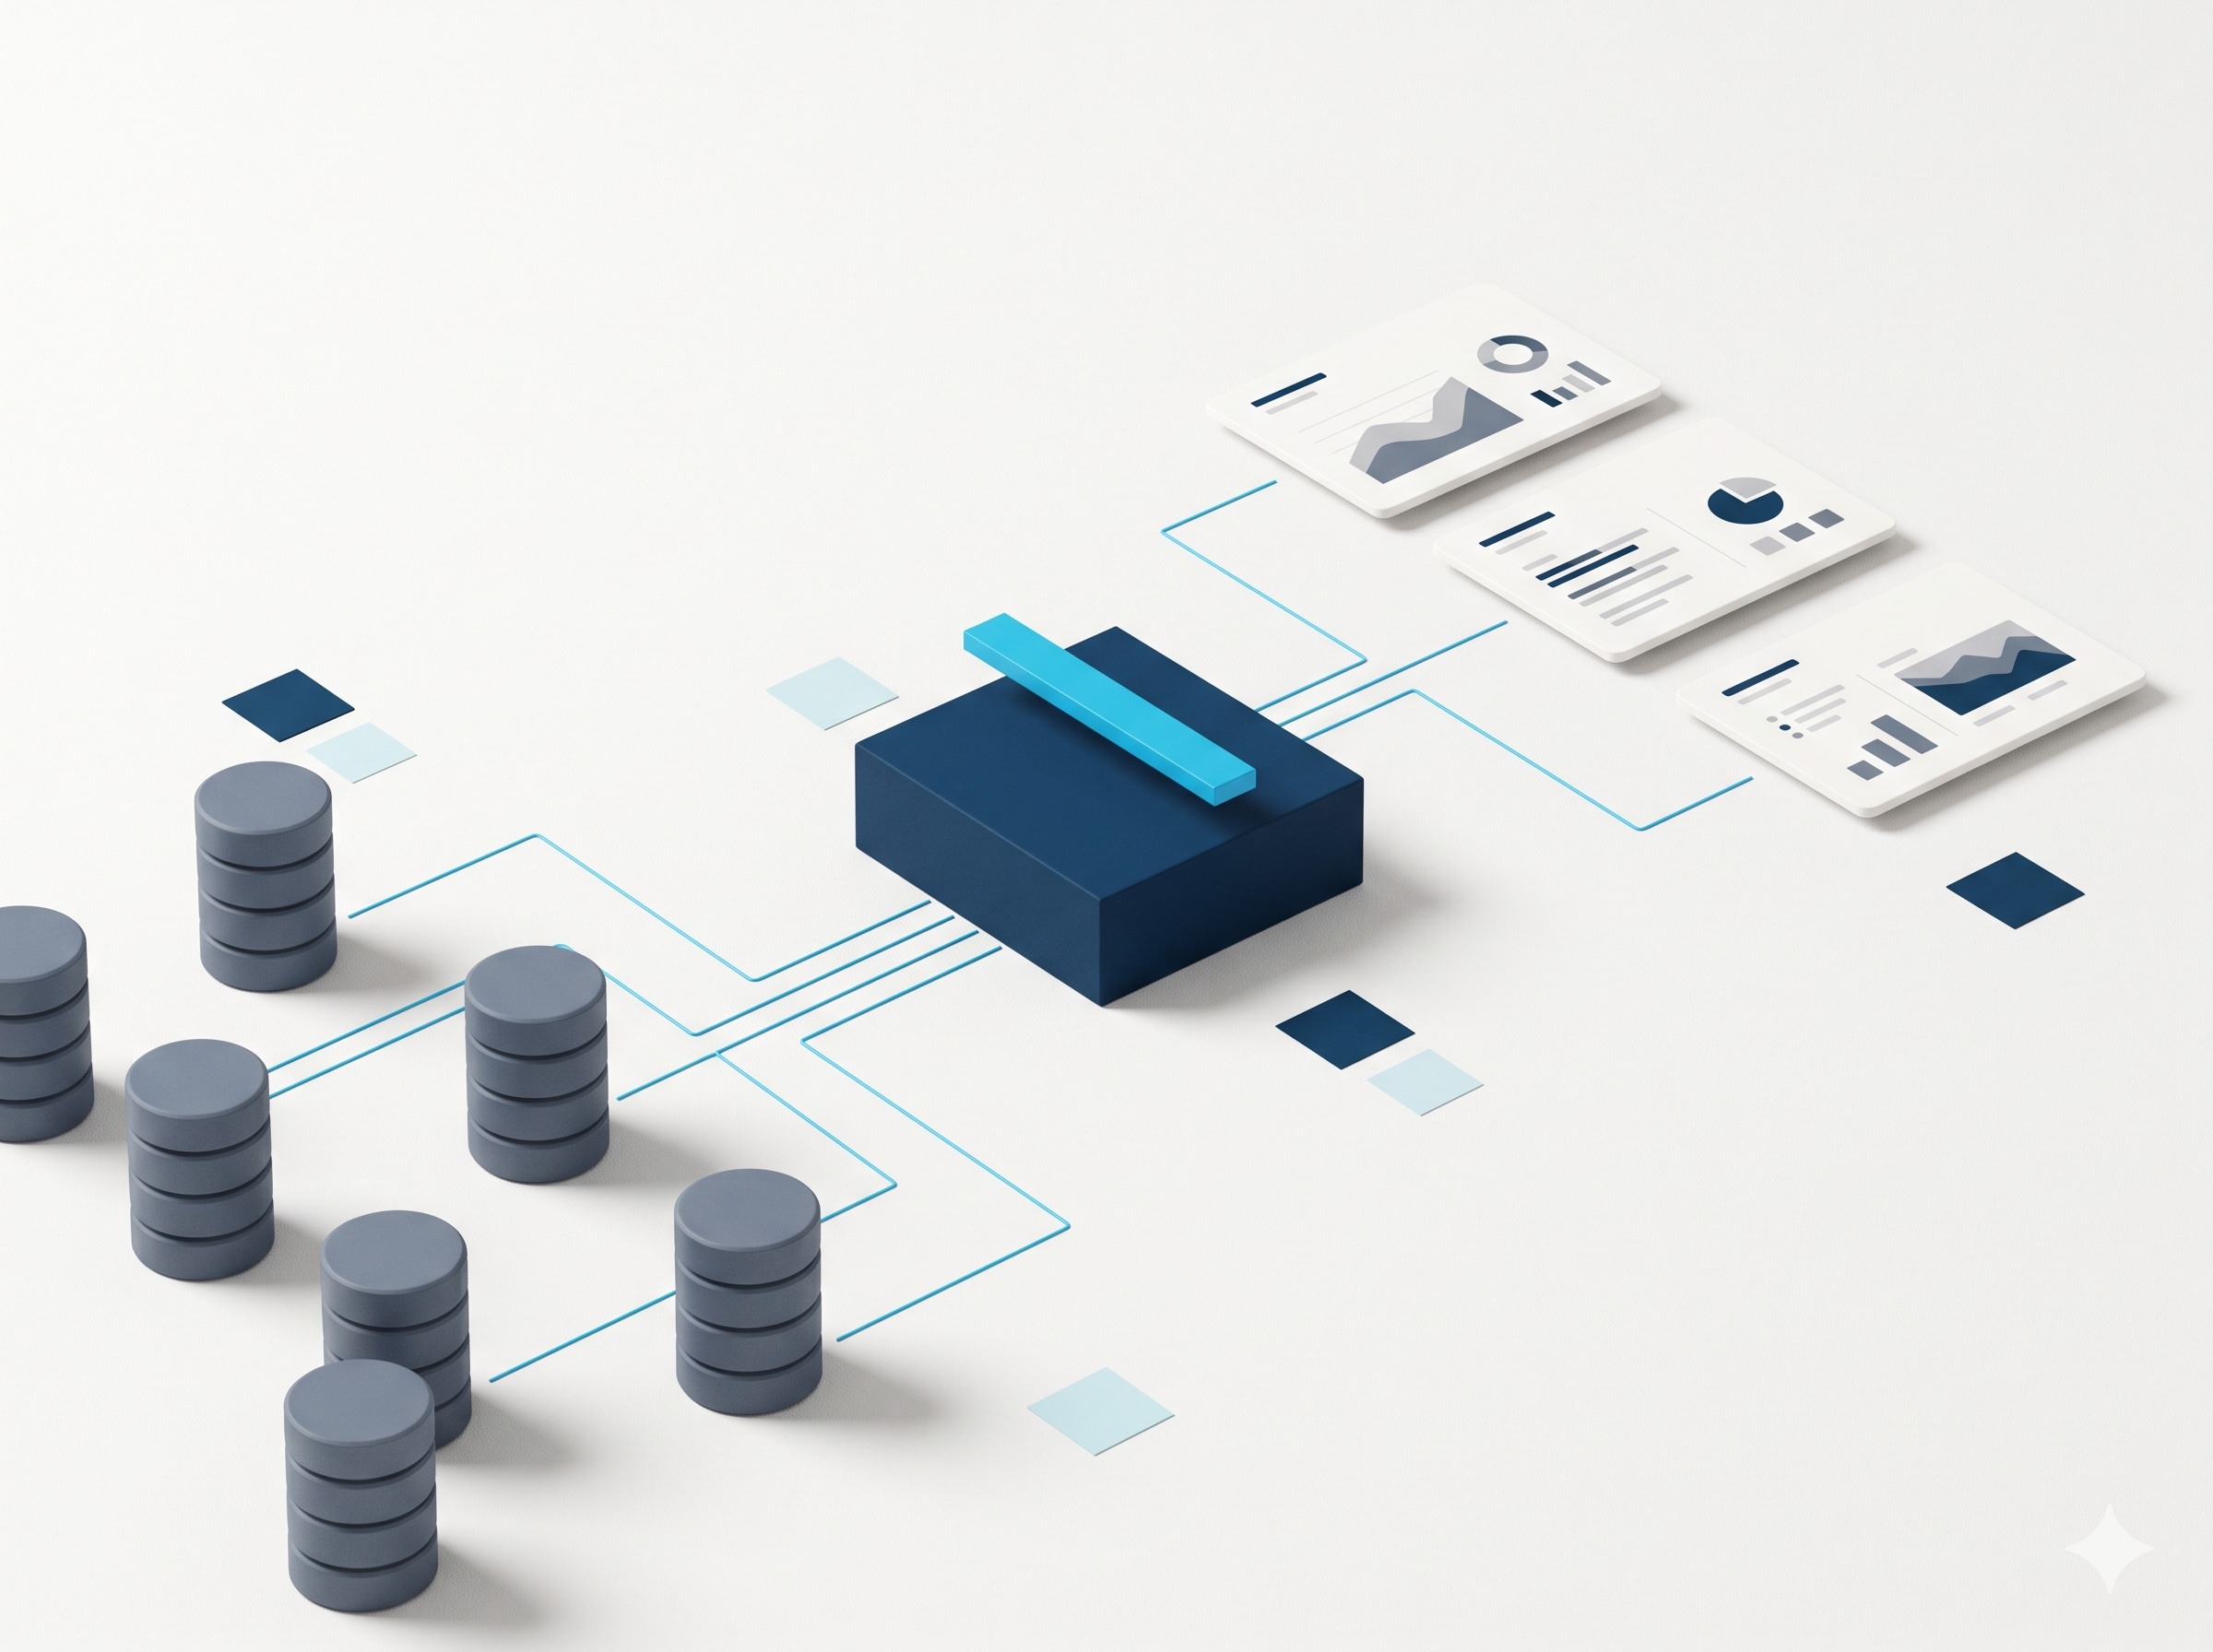
A cloud-native warehouse that ingests, normalizes, and stores data automatically.
Dashboards are worthless when no one trusts the figure. We build the warehouse, the semantic layer, and the observability that makes one number mean one thing everywhere.
Analysts write brittle custom scripts to pull data from disconnected silos.
A cloud-native warehouse that ingests, normalizes, and stores data automatically.
End users cannot trust the numbers, so the dashboards go unused.
A semantic layer that defines core metrics identically across every visualization tool.
Manual error checking scales poorly and misses problems before reports ship.
Software that monitors pipelines and flags anomalies, schema changes, and nulls before executives see them.
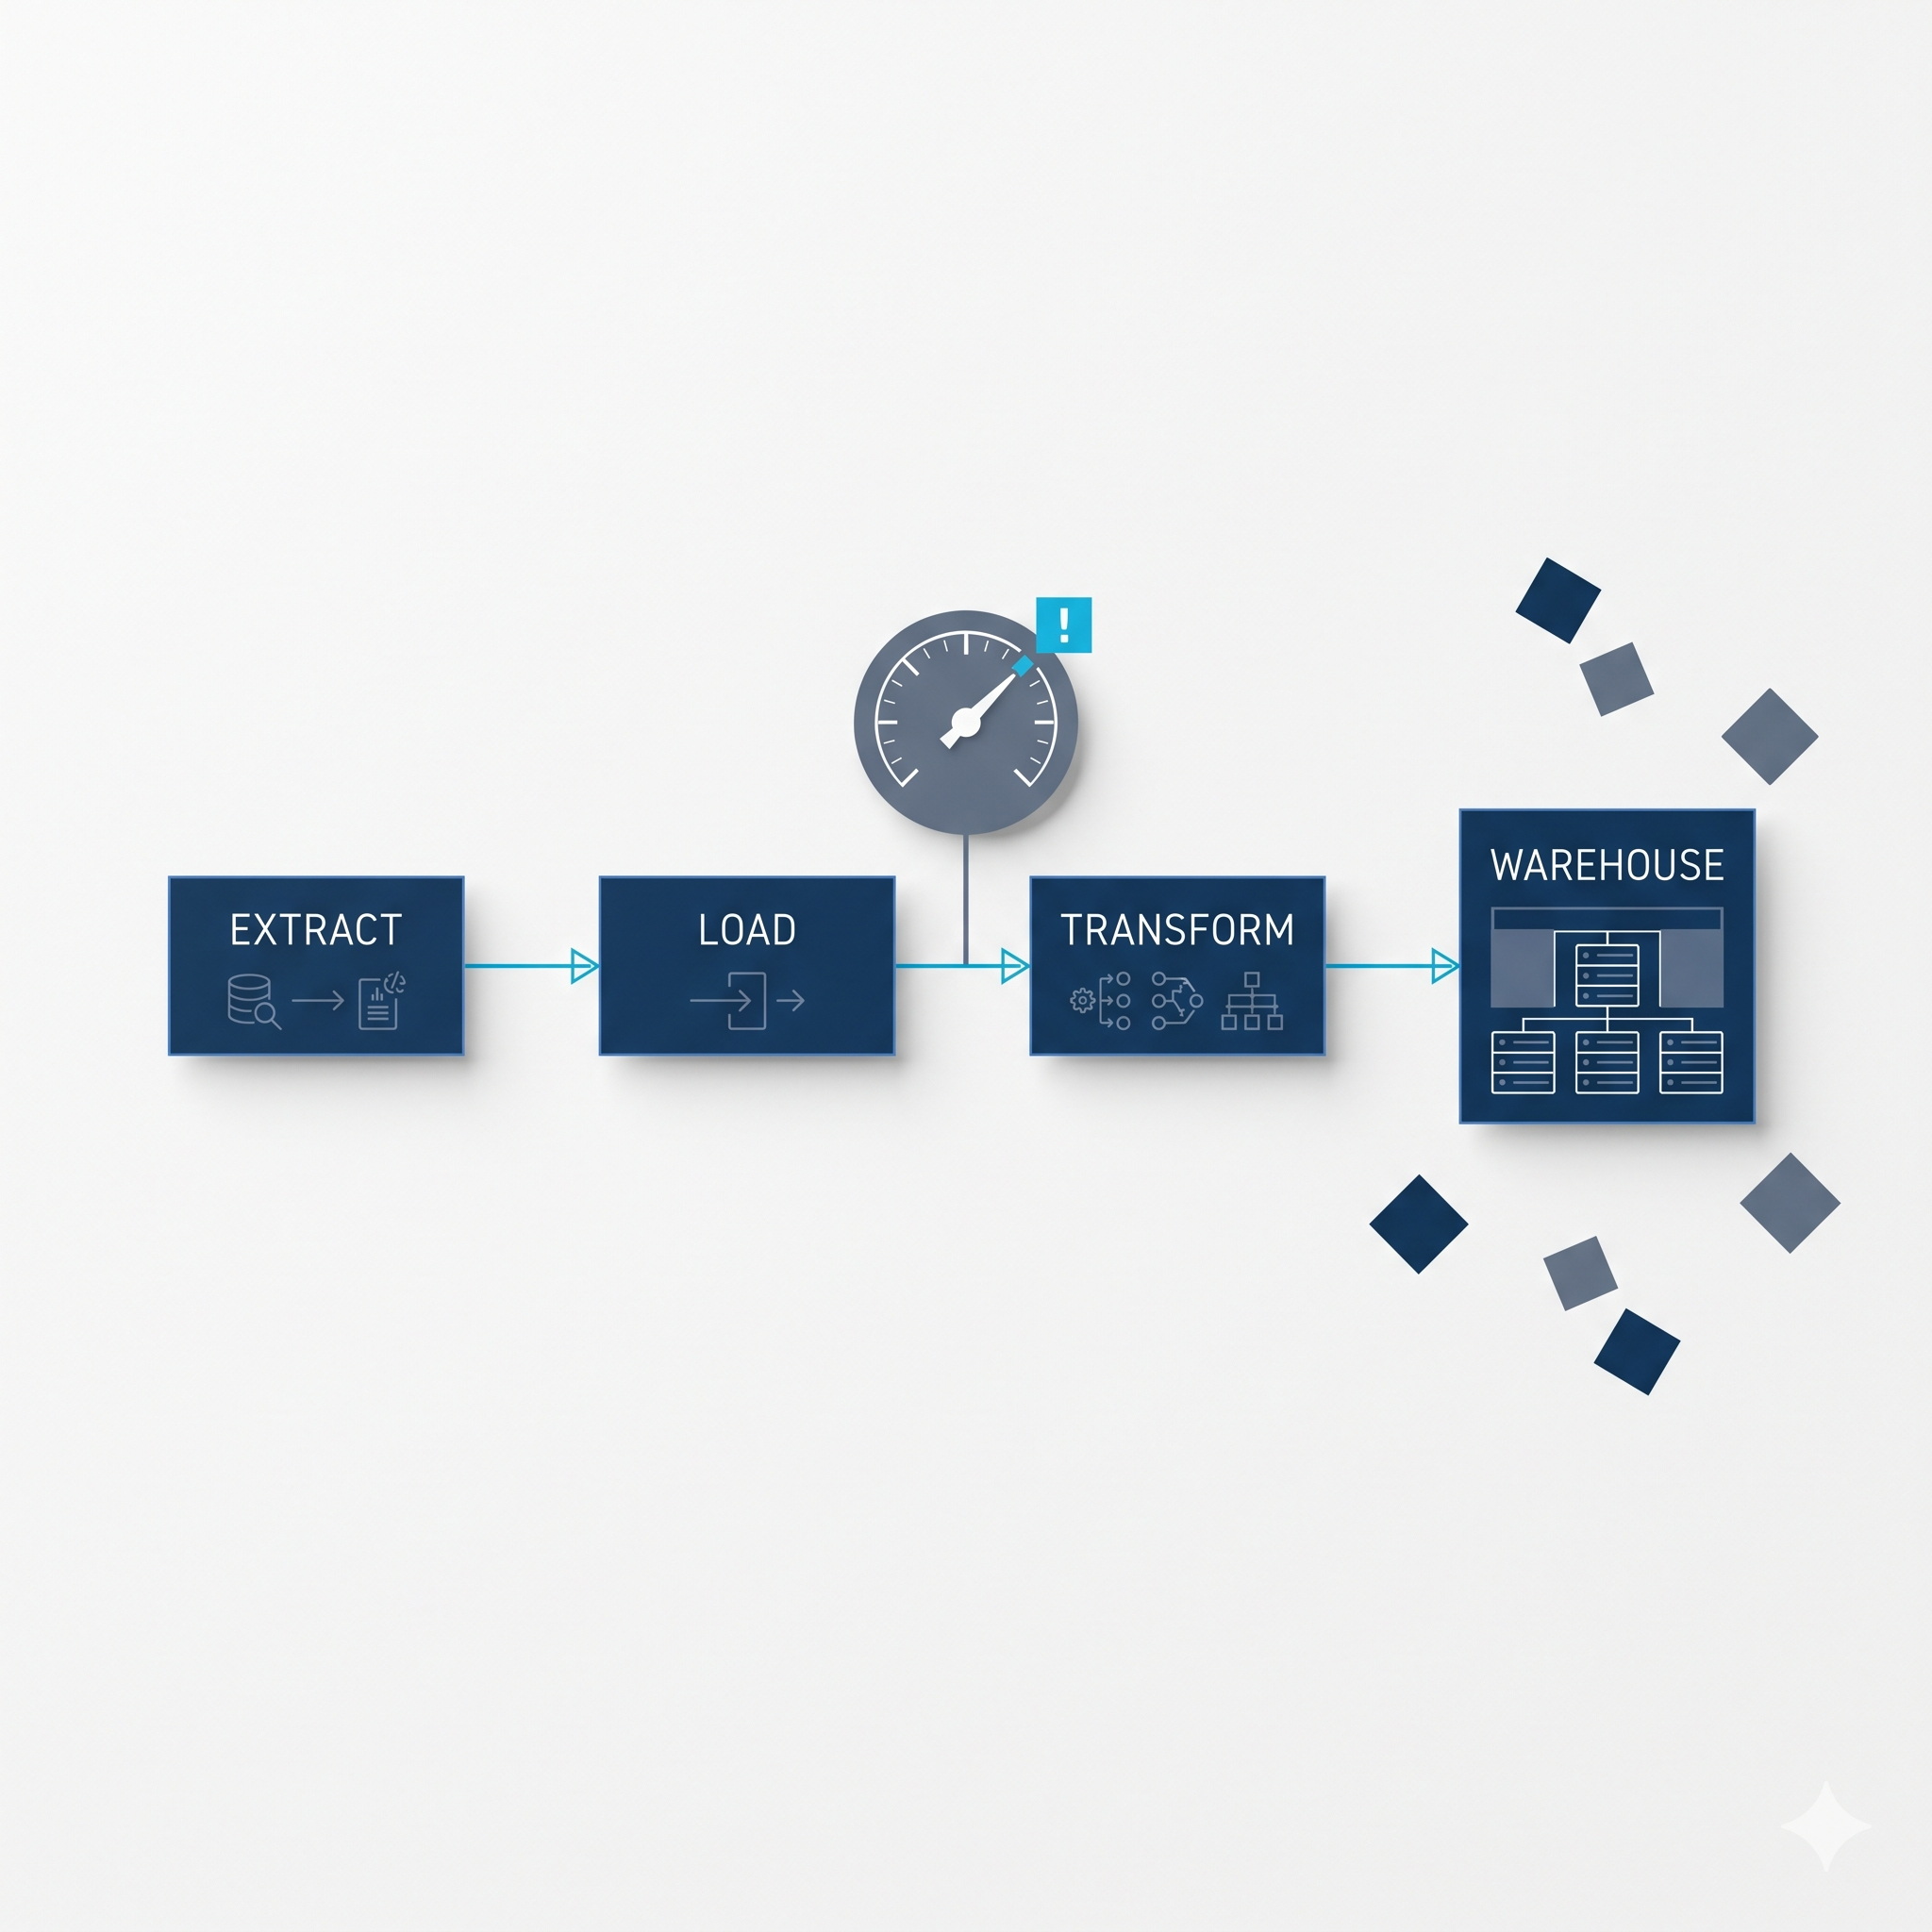
Manual, messy ingestion becomes automated, tidy output .
Raw documents flow through extraction and a semantic layer , so what comes out is structured, governed, and means the same thing in every tool downstream.
Global spending on big data and analytics signals serious investment in decision infrastructure.
Governance as code automates policy enforcement directly inside data pipelines.
Time to resolve a data quality incident jumped to 15 hours, demanding better monitoring.
When departments define revenue differently, dashboards go unused and decisions stall. These figures describe the data and analytics sector, not Techtiz engagements—and what poor data quality costs.
Average annual cost of poor data quality per organization
Gartner, 2026
New data records that contain at least one critical error at entry
MIT Sloan, 2026
Companies whose data meets basic quality standards
Harvard Business Review, 2026
Average share of revenue hurt by data quality failures
Monte Carlo, 2023
Snowflake, BigQuery, or Postgres with dbt-driven ELT, built to ingest and normalize automatically.
Core business metrics defined once, so revenue means the same thing in every tool.
Anomalies, schema changes, and nulls are caught before they reach executive reports.
Formal contracts between software and analytics teams keep upstream changes from breaking reports.
For SLED scope under NAICS 518210, we build governed analytics layers as your subcontractor, with PII handled to standard, never facing the agency.
NDA-first, subcontract-only. We work behind the prime, under your brand. We do not pursue prime contracts and we never face the agency.
Parallel analytics layer. ELT runs without altering operational databases, so live applications stay fast.
Lineage you can show. Transparent data lineage, tested pipelines, and strict handling of personally identifiable information.
We implement a semantic layer that centralizes the mathematical definition of core business metrics.
No. We use read-replicas or scheduled batch processing during off-peak hours to protect application performance.
Automated observability tools alert the engineering team the moment a data anomaly or schema change is detected.
We establish formal data contracts so software teams and analytics teams share technical accountability.
Which is exactly why we start with data contracts and lineage tracing, so upstream schema changes do not silently break downstream reporting.
Tell us the metric two teams define differently. That is where the semantic layer starts.
Scope a data platform